


 Last updated: July 28, 2026
Data current as of: July 2026
Quick answer
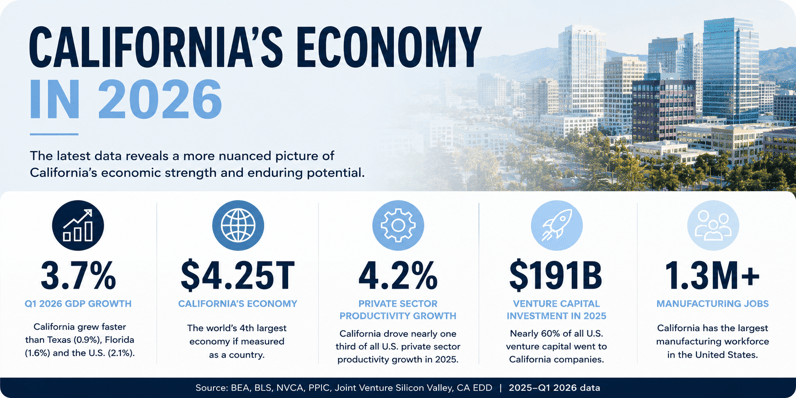
California’s economy grew faster than Texas and Florida during the first quarter of 2026, with annualized real GDP growth of 3.7%. However, California did not lead those states over every longer-term period. Its principal strengths remain economic scale, productivity and venture capital, while elevated unemployment, housing costs and uneven job creation remain significant weaknesses.
California economy at a glance
| Indicator | Period | California result | Comparison or context | Source |
|---|---|---|---|---|
| Real GDP growth | Q1 2026 | 3.7% annualized | U.S. 2.1%; Florida 1.6%; Texas 0.9% | BEA |
| Current-dollar GDP | 2025 | Approximately $4.25 trillion | Texas $2.90 trillion; Florida $1.83 trillion | BEA |
| Private nonfarm productivity | 2025 | 4.2% growth | National growth was 1.8% | BLS |
| Venture deal value | 2025 | $191.2 billion | 59.8% of the U.S. total | NVCA |
| Unemployment | June 2026 | 5.2% | U.S. 4.2%; Texas 4.4%; Florida 4.7% | EDD and BLS |
| International economic rank | Based on 2024 data | Fourth | Behind the U.S., China and Germany | PPIC |
In this article
- California’s first-quarter 2026 GDP growth
- California’s economic size and international ranking
- Annual and long-term growth comparisons
- California labor productivity
- Venture capital and artificial intelligence
- Manufacturing, exports and agriculture
- Unemployment and job growth
- Silicon Valley housing and commercial real estate
- What the data may mean for San Jose and Urban Catalyst
- Frequently asked questions
California is frequently described in extremes.
Depending on the headline, the state is either the world’s center of innovation or a place in irreversible economic decline. Neither version tells the whole story.
California has serious challenges. Housing is extraordinarily expensive. Unemployment remains above the national average. Job growth is uneven, and some industries are employing fewer people than they were a year ago.
But the latest economic data does not support the broader claim that California’s economy is collapsing. Several recently released indicators show that the state remains one of the largest, most productive and most heavily funded centers of innovation in the world.
The strongest case for California is not that the state wins every comparison. It is that California continues to generate extraordinary economic output, productivity and innovation while confronting constraints that require more housing, infrastructure and disciplined development.
California grew faster than Texas and Florida in early 2026
The U.S. Bureau of Economic Analysis’ June 25 third estimate shows that California’s real gross domestic product grew at a seasonally adjusted annual rate of 3.7% during the first quarter of 2026.
The comparison was highlighted in a July 24, 2026 article from the Governor of California. The underlying GDP figures come from the U.S. Bureau of Economic Analysis.
| Economy | Q1 2026 real GDP growth |
| California | 3.7% |
| Florida | 1.6% |
| Texas | 0.9% |
| United States | 2.1% |
Source: U.S. Bureau of Economic Analysis. Rates are seasonally adjusted and annualized.
These figures measure inflation-adjusted growth and are annualized. California’s economy did not grow 3.7% in three months. The number represents what that quarter’s pace would produce over a full year if it continued. State GDP estimates also remain subject to later revision.
One quarter does not establish a permanent trend. Still, the result is meaningful: during that period, California’s growth outpaced the national economy and two states frequently presented as faster-growing alternatives.
The data establishes the size of the quarterly increase. It does not, by itself, prove which California industries caused it.
California’s economic scale is difficult to overstate
In current dollars, California generated approximately $4.25 trillion in economic output during 2025, compared with approximately $2.90 trillion in Texas and $1.83 trillion in Florida.
That means California’s economy was approximately:
- 47% larger than Texas’ economy;
- 2.3 times the size of Florida’s economy; and
- responsible for about 14% of total U.S. economic output.
To be precise, California was larger than Texas or Florida individually—not larger than the two states combined.
Using 2024 internationally comparable data, the Public Policy Institute of California estimates that California would rank as the world’s fourth-largest economy if measured as a country, behind the United States, China and Germany. PPIC also reports that California’s economic output per resident exceeds that of each of those national economies.
Scale alone does not guarantee future growth. But it matters. California is not a narrow economy dependent on one employer or industry. It contains an unusually large concentration of businesses, research institutions, talent, capital and intellectual property.
A fair comparison requires looking beyond one quarter
The first-quarter 2026 figures favor California, but they should not be used to suggest that California consistently grows faster than Texas and Florida.
From the 2024 annual level to the 2025 annual level, real GDP increased by approximately:
| State | 2025 real GDP growth |
| Florida | 3.1% |
| Texas | 2.5% |
| California | 2.5% |
Source: U.S. Bureau of Economic Analysis annual state GDP estimates.
California and Texas were essentially tied during 2025, while Florida grew faster.
The longer-term comparison is similarly nuanced. Between the annual 2020 and 2025 levels, California’s economy grew at an average annual rate of approximately 3.0%, compared with 5.0% in Texas and 5.4% in Florida.
Over the past 25 years, however, California’s real economy expanded by approximately 90%, exceeding the 69% growth of the United States as a whole. Texas grew by approximately 130% and Florida by 101%, aided in part by much faster population growth. PPIC reports that, on a per-person basis, California’s long-term GDP growth outperformed the other large states in its comparison.
This is the more defensible conclusion: California is not winning every growth comparison, but the data is also inconsistent with the idea that its economy has entered a broad or irreversible decline.
Productivity may be the most important number
Headline GDP figures receive the most attention, but California’s productivity performance may be more consequential.
According to the U.S. Bureau of Labor Statistics, California’s private nonfarm labor productivity increased 4.2% in 2025. Only the District of Columbia and Arizona recorded higher rates.
California accounted for about 14% of national private nonfarm output, yet contributed nearly one-third of the country’s 1.8% productivity gain. Within California, real output rose 2.9% while hours worked declined 1.2%.
Productivity measures the economic output produced for each hour worked. Over time, it is an important indicator of an economy’s ability to become more efficient, support higher living standards and remain competitive.
California’s concentration of technology, artificial intelligence, life sciences, advanced manufacturing, professional services and research provides a plausible setting for productivity gains. The BLS data, however, does not attribute the increase to any particular industry or technology.
Nor does higher productivity mean that every worker or community benefits equally. It does show that California played an outsized role in increasing the productive capacity of the national economy during 2025.
California continues to dominate venture capital
California’s access to innovation capital remains unmatched among U.S. states.
The 2026 National Venture Capital Association Yearbook reports approximately $320 billion in U.S. venture deal value across 15,352 deals during 2025. California-headquartered companies recorded approximately $191.2 billion across 4,846 deals—59.8% of the national total.
| State | 2025 venture deal value |
| California | $191.2 billion |
| Texas | $12.8 billion |
| Florida | $7.2 billion |
Source: National Venture Capital Association 2026 Yearbook.
Those figures generally assign investment according to company headquarters. They do not necessarily identify where every resulting job or dollar of spending occurred.
Artificial intelligence was a major driver of the national market. An earlier, preliminary PitchBook-NVCA Venture Monitor estimated $339.4 billion in total 2025 U.S. venture deal value, including $222.1 billion—or 65.4%—for artificial intelligence and machine learning. The later NVCA Yearbook revised the overall market total to $320 billion, so the preliminary AI figure and percentage should not be calculated against that later denominator.
Using a separate CB Insights dataset, the 2026 Silicon Valley Index reports that Silicon Valley and San Francisco together attracted approximately $92 billion in venture capital during 2025.
The Index also estimates that more than 23,000 utility patents were granted in 2025 to assignees in its defined Silicon Valley geography, annualized from data available through September. Silicon Valley and San Francisco together contained 312 privately held companies valued above $1 billion, including 27 valued above $10 billion.
These datasets use different definitions and should not be treated as directly interchangeable. Together, however, they demonstrate the continued concentration of capital and innovation activity in California.
Capital can move quickly. Its continued concentration in the state suggests that investors and entrepreneurs still place substantial value on California’s talent, networks, universities and technology ecosystem. It does not mean every industry or local market is expanding at the same pace.
California’s economy is more diverse than its technology reputation suggests
Technology is central to California’s identity, but the state’s economy extends far beyond Silicon Valley.
According to PPIC, private industries generate approximately 90% of California’s GDP. Real estate and finance and professional services each account for about 17%, information for 15%, manufacturing for 10%, and health care for 7%. Health care also accounts for roughly 18% of California jobs.
California-origin goods exports totaled approximately $188.4 billion in 2025, or 8.6% of U.S. goods exports. Computer and electronic products represented 18% of U.S. exports in that category.
“Origin of movement” identifies where goods began their export journey, which is not always the same as where they were produced.
PPIC separately estimates that California exported approximately $193 billion in services in 2023, representing about 19% of U.S. services exports.
California also has the nation’s largest state manufacturing workforce. Official payroll data counted approximately 1.21 million manufacturing jobs in June 2026, while current BEA estimates put the industry’s 2025 contribution to state GDP—its value added—at approximately $385.1 billion.
Agriculture remains a nationally important California industry. According to the California Department of Food and Agriculture, farms generated approximately $61.2 billion in cash receipts in 2024 and exported $23.8 billion in agricultural products. That equaled approximately 13.5% of the U.S. total under CDFA’s methodology. California produces nearly half of U.S. vegetables and more than three-quarters of its fruits and nuts.
The result is an economy supported by technology, real estate, finance, entertainment, logistics, agriculture, manufacturing, tourism, health care, professional services and international trade.
The labor market remains a legitimate weak point
California’s strong GDP and productivity figures should not obscure its softer labor market.
According to California’s June employment report, the state’s preliminary, seasonally adjusted unemployment rate was 5.2% in June 2026. That compared with 4.2% nationally, 4.4% in Texas and 4.7% in Florida.
California’s rate improved from 5.5% one year earlier. Florida’s rate, by comparison, increased from 3.8% to 4.7% during the same period.
Preliminary payroll estimates showed California with approximately 106,900 more jobs than in June 2025, but BLS classified the year-over-year change as statistically unchanged. That wording does not mean the published estimate was zero; it means the agency could not distinguish the estimate from zero at its statistical-significance threshold.
Growth was also uneven. Construction employment was approximately 15,400 jobs lower than a year earlier, while manufacturing employment was down approximately 13,300 jobs.
This helps explain why public perceptions can differ so sharply from top-line economic data. An economy can generate more output as businesses and workers become more productive even while hiring remains slow. Growth can also be concentrated in a relatively small number of high-value industries and companies.
California’s challenge is therefore not only to produce economic growth. It is to translate that growth into broader job creation, housing accessibility and economic opportunity.
Silicon Valley illustrates both sides of California’s story
Silicon Valley remains highly productive and exceptionally well capitalized, but the region’s success has also intensified pressure on the cost of living.
PPIC reports that per-capita personal income in its broader Bay Area geography reached approximately $133,000 in 2024 and that the median wage among full-time workers was about $37 per hour.
Using a different regional definition, the 2026 Silicon Valley Index reports that the median single-family home price reached approximately $1.98 million at the end of 2025. It also estimates that 28% of working-age households in Santa Clara and San Mateo counties did not earn enough to meet basic needs without public or private assistance.
Commercial real estate remains under pressure. According to the Joint Venture Silicon Valley and JLL Q1 report, regional office vacancy reached 22.5% in the first quarter of 2026, above the 21.7% peak following the dot-com crash. Lab vacancy reached 34.8%.
Across property types, inflation-adjusted asking rents declined approximately 3% from a year earlier and were at their lowest level since 2015.
Commercial space under construction fell to 3.12 million square feet, its lowest level since the first quarter of 2012. Leasing nevertheless totaled 7.8 million square feet during the quarter. If sustained, that pace would produce the market’s highest annual leasing volume since 2022, although renewals accounted for 36% of the activity.
This is neither a simple boom story nor a collapse story.
It is the story of a region navigating major changes in technology and workplace patterns while continuing to struggle with a severe mismatch between housing costs and what many households can afford.
Urban Catalyst perspective: What this means for San Jose
Disclosure: Urban Catalyst has commercial interests in downtown San Jose, and this section reflects the company’s perspective. This article is provided for general informational purposes. Any investment offering is made solely through the applicable offering documents, which should be reviewed with appropriate financial, legal and tax professionals.
Macroeconomic statistics do not guarantee the success of an individual real estate project or investment. Project outcomes depend on acquisition basis, design, entitlements, financing, construction costs, market demand, rents, absorption and execution.
Regional real estate also does not exist separately from the surrounding economy. Over time, employment, productivity, household income, business formation, capital investment, infrastructure and available supply can all influence demand.
For Urban Catalyst, the defensible case for downtown San Jose does not require claiming that California is free from problems. It begins with the fact that San Jose sits within one of the world’s largest and most innovative regional economies—and within a city with a substantial, officially recognized housing need.
San Jose’s certified 2023–2031 Housing Element includes a Regional Housing Needs Allocation of 62,200 homes.
That planning requirement helps establish the scale of the city’s housing challenge. It does not, by itself, establish demand, financial feasibility, absorption, rents or investment returns for any individual development.
High housing costs are consistent with a longstanding regional housing-supply constraint, but they also reflect incomes, interest rates, land and construction costs, regulation and the composition of the available housing stock. They should be treated as evidence of a complex market—not as automatic proof of a particular project’s viability.
The more grounded Urban Catalyst thesis is therefore regional and long term: Silicon Valley continues to possess unusual concentrations of productivity, talent, capital and innovation, while San Jose faces a documented need for additional housing and well-located infill development.
Whether a particular project captures that opportunity depends on project-level economics and execution.
The bottom line
California does not need another cheerleading story. It needs an accurate data story.
The latest evidence shows that:
- California grew faster than Texas, Florida and the United States during the first quarter of 2026.
- Its approximately $4.25 trillion current-dollar economy remains much larger than either Texas or Florida individually.
- California’s private nonfarm labor productivity increased 4.2% in 2025, contributing nearly one-third of the national productivity gain.
- California-headquartered companies attracted 59.8% of U.S. venture deal value in the later NVCA Yearbook dataset.
- Silicon Valley and San Francisco continue to lead in capital formation, while Silicon Valley remains a major center of patent activity.
- California also has above-average unemployment, extreme housing costs and uneven job creation that cannot be dismissed.
The honest conclusion is not that California outperforms every state on every measure. It is that California remains an extraordinarily large, productive and innovative economy working through serious constraints.
For investors, businesses, developers and policymakers, the useful question is not whether California is simply “winning” or “losing.”
The more important question is where economic output, talent, capital, infrastructure and documented need intersect—and whether a particular strategy is positioned to serve that intersection successfully.
San Jose remains one of the places where those forces converge.
Frequently asked questions
Did California grow faster than Texas and Florida in 2026?
California grew faster during the first quarter of 2026. Its real GDP increased at a 3.7% annualized rate, compared with 1.6% in Florida and 0.9% in Texas. One quarter does not establish a longer-term trend, and California did not outperform both states over every annual or multiyear period.
How large is California’s economy?
California generated approximately $4.25 trillion in current-dollar GDP during 2025. That made its economy about 47% larger than Texas’ economy and approximately 2.3 times the size of Florida’s economy.
Is California really the world’s fourth-largest economy?
Using 2024 internationally comparable data, PPIC estimates that California would rank fourth if measured as a country. It would rank behind the United States, China and Germany.
Why can California’s economy grow while unemployment remains elevated?
Economic output can increase because businesses and workers are becoming more productive even when hiring is slow. California’s private nonfarm productivity rose 4.2% in 2025, while its unemployment rate remained above the national average in June 2026.
What share of U.S. venture capital went to California?
The 2026 NVCA Yearbook reports that California-headquartered companies attracted approximately $191.2 billion in 2025 venture deal value. That represented 59.8% of the U.S. total in that dataset.
Does the economic data predict the performance of San Jose real estate investments?
No. Regional GDP, productivity, venture capital and housing need provide economic context, but they do not establish the financial feasibility or future performance of a particular project. Project outcomes depend on financing, costs, demand, rents, absorption and execution.
Methodology note
The article distinguishes between real GDP growth, which is adjusted for inflation, and current-dollar GDP, which measures the nominal size of the economy. Quarterly GDP growth rates are annualized. Sources use different reporting periods, geographic definitions and revision schedules, so figures from separate datasets should not be combined unless their methodologies are compatible.
Important Disclosures
The contents of this communication: (i) do not constitute an offer of securities or a solicitation of an offer to buy securities, (ii) offers can be made only by the confidential Private Placement Memorandum (the “PPM”) which is available upon request, (iii) do not and cannot replace the PPM and is qualified in its entirety by the PPM, and (iv) may not be relied upon in making an investment decision related to any investment offering by an issuer, or any affiliate, or partner thereof ("Issuer").
All potential investors must read the PPM and no person may invest without acknowledging receipt and complete review of the PPM.
With respect to any performance levels outlined herein, these do not constitute a promise of performance, nor is there any assurance that the investment objectives of any program will be attained. All investments carry the risk of loss of some or all of the principal invested. Assumptions are more fully outlined in the Offering Documents/ PPM for the respective offering. Consult the PPM for investment conditions, risk factors, minimum requirements, fees and expenses and other pertinent information with respect to any investment.
These investment opportunities have not been registered under the Securities Act of 1933 and are being offered pursuant to an exemption therefrom and from applicable state securities laws. All offerings are intended only for accredited investors unless otherwise specified.
Past performance are no guarantee of future results. All information is subject to change. You should always consult a tax professional prior to investing. Investment offerings and investment decisions may only be made on the basis of a confidential private placement memorandum issued by Issuer, or one of its partner/issuers. Issuer does not warrant the accuracy or completeness of the information contained herein. Thank you for your cooperation.
Real Estate Risk Disclosure:
- There is no guarantee that any strategy will be successful or achieve investment objectives including, among other things, profits, distributions, tax benefits, exit strategy, etc.;
- Potential for property value loss – All real estate investments have the potential to lose value during the life of the investments;
- Change of tax status – The income stream and depreciation schedule for any investment property may affect the property owner’s income bracket and/or tax status. An unfavorable tax ruling may cancel deferral of capital gains and result in immediate tax liabilities;
- Potential for foreclosure – All financed real estate investments have potential for foreclosure;
- Illiquidity – These assets are commonly offered through private placement offerings and are illiquid securities. There is no secondary market for these investments.
- Reduction or Elimination of Monthly Cash Flow Distributions – Like any investment in real estate, if a property unexpectedly loses tenants or sustains substantial damage, there is potential for suspension of cash flow distributions;
- Impact of fees/expenses – Costs associated with the transaction may impact investors’ returns and may outweigh the tax benefits
- Stated tax benefits – Any stated tax benefits are not guaranteed and are subject to changes in the tax code. Speak to your tax professional prior to investing.
Opportunity Zone Disclosures
- Investing in opportunity zones is speculative. Opportunity zones are newly formed entities with no operating history. There is no assurance of investment return, property appreciation, or profits. The ability to resell the fund’s underlying investment properties or businesses is not guaranteed. Investing in opportunity zone funds may involve a higher level of risk than investing in other established real estate offerings.
- Long-term investment. Opportunity zone funds have illiquid underlying investments that may not be easy to sell and the return of capital and realization of gains, if any, from an investment will generally occur only upon the partial or complete disposition or refinancing of such investments.
- Limited secondary market for redemption. Although secondary markets may provide a liquidity option in limited circumstances, the amount you will receive typically is discounted to current valuations.
- Difficult valuation assessment. The portfolio holdings in opportunity zone funds may be difficult to value because financial markets or exchanges do not usually quote or trade the holdings. As such, market prices for most of a fund’s holdings will not be readily available.
- Capital call default consequences. Meeting capital calls to provide managers with the pledged capital is a contractual obligation of each investor. Failure to meet this requirement in a timely manner could elicit significant adverse consequences, including, without limitation, the forfeiture of your interest in the fund.
- Opportunity zone funds may use leverage in connection with certain investments or participate in investments with highly leveraged capital structures. Leverage involves a high degree of financial risk and may increase the exposure of such investments to factors such as rising interest rates, downturns in the economy or deterioration in the condition of the assets underlying such investments.
- Unregistered investment. As with other unregistered investments, the regulatory protections of the Investment Company Act of 1940 are not available with unregistered securities.
- It is possible, due to tax, regulatory, or investment decisions, that a fund, or its investors, are unable realize any tax benefits. You should evaluate the merits of the underlying investment and not solely invest in an opportunity zone fund for any potential tax advantage.
The above material cannot be altered, revised, and/or modified without the express written consent of Urban Catalyst.